Niteco Solution Architect Tien Man Quach investigates the cause of an issue with an Optimizely Commerce site using Section IO.
Recently, I encountered a strange issue with my latest release for an Optimizely Commerce website. Everything was working fine, all test cases passed across the different environments, yet we encountered a Production-only problem after the release.
First of all, I'd like to give everyone an idea about the architecture of our customer's Commerce site. It is an Optimizely Commerce 12 website that serves 2 different markets, Australia (AU) and New Zealand (NZ). Though each market has its own web domain, there is only one site definition in the CMS and it’s handled through separate languages using one codebase, app settings and database. Each has its own site settings/configurations handled in the CMS.
In terms of infrastructure:
- The website is hosted on 5 web servers load-balanced within the AWS ALB
- Each web server is an EC2 with the site hosted on IIS, mapped to two sets of DNS/URL for AU and NZ
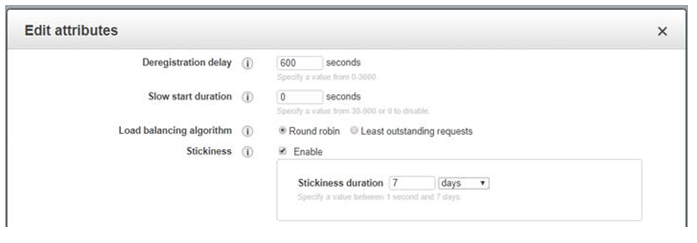
- The load balancer has Sticky Session enabled and follows the Round-Robin algorithm
- Newrelic is used for application performance management
- And Section IO is used for CDN, WAF, Caching Reverse Proxy, Image optimizations, Virtual Waiting Room and other features.
The Problem
When we accessed the checkout page on the NZ site, (i.e. thenzsite.com/checkout), one of the APIs that getting called in the background was "/loadminicart", using the GET method. For some reason, this API call took a very long time to respond (over 60 seconds), which lead to a 504 timeout issue being returned by Section IO – as expected, given the current configuration is 60 seconds. Strangely, this issue only happens on the checkout page of the NZ site. No other page in NZ is affected, neither is AU or its corresponding checkout page.

Investigation
Based on the first investigation by the Section IO support team as well as through viewing Newrelic reports, the slow response seems to point to the AcquireRequestState being the culprit, as it took too long to process, as shown in the screenshots below.

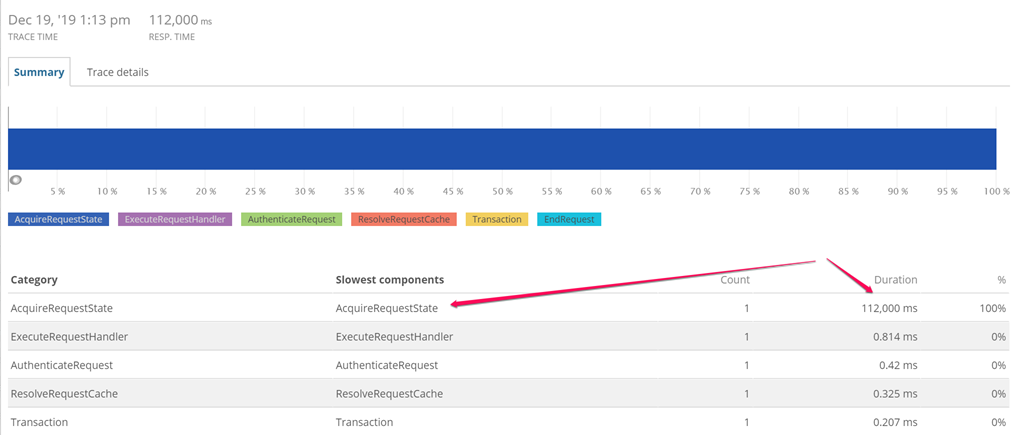
We couldn't say definitively if this was the only issue, but the slowdown of this function appears to be related to several timeouts. AcquireRequestState is a common ASP.net bottleneck, common enough to have plenty of articles online about it.
As a workaround, Section IO tried extending their Varnish pipe timeout to 120 seconds (by default, this is 60 seconds, i.e. Varnish will timeout on a pipe if the origin takes more than 60 seconds to respond). However, this is not recommended, since it’s definitely not a good practice because our origin (ALB) could still possibly timeout. Doing that just give it a little more time to respond.
Could this be a problem with the new codebase that was recently released? It could have been, though I didn't think so. Hence, I decided to test the new codebase by jumping on the Production servers themselves, testing them locally to bypassing SectionIO/the Internet. The good thing was that we couldn't reproduce this issue on any server, no matter how fast or how many tabs I opened for the "/checkout" page on the NZ site. It was all working well.
Because of the time constraints and since we were running out of the allocated deployment time, we decided to revert Production back to previous. We wanted to see if the problem had already been there before. Then I started looking into Section IO’s traffic history report and found that the issue had existed for a while. It had been there for at least 7 days (which is the maximum history that Section IO shows). So at this stage, we had at least proved that this was an existing issue, not a new bug.
I was struggling with a lot of questions about what, where, why, like:
- Why did this problem only occur for external requests? We didn't encounter this for internal requests on any single web server.
- Why did it only happen on the NZ checkout page, while the other pages were functioning well? The AU site didn't encounter this problem at all.
- Was there any problem with our codebase, like AcquireRequestState? Was this a very common issue? If so, why didn't we have it on the AU site?
- Was there any problem with the web server IIS or web app configuration? No, as both sites were hosted in one single web app on IIS with the same app settings and configurations.
- Why did nobody pick up on it even though it had been there for a while?
- ...
Troubleshooting
So, what was the problem? Where could the issue have come from? No matter what everybody else said, I had a feeling that this issue was not rooted in the codebase. It shouldn't have been an infrastructure issue either. So I guessed there had to be something wrong with Section IO. However, the question was, "How can we prove that?"
First, I needed to know if there was any difference between AU and NZ in terms of configurations or modules on the Section IO stack... After a back-and-forth conversation with Section IO, it turned out we were using different set modules on Section IO for the Australia and New Zealand sites:
- AU used: Virtual Waiting Room -> Varnish -> Kraken -> Openresty
- NZ used: Virtual Waiting Room -> Varnish -> Pagespeed
And Section IO confirmed that there had been no recent changes on their side so the problem couldn't have come from Section IO. However, I didn't agree with this because of the following point. Let's look into the test results for the "loadminicart" GET API call:
- On AU site – All Good
- Just the URL directly worked all the time. No matter how many tabs I was opening or how quickly I opened them. No problem occurred. – Good
- Opened the checkout page, which also loaded that URL. Worked fine every time – Good
- On NZ site
- Just the URL directly worked all the time. No matter how many tabs I was opening or how quickly I opened them. No problem occurred. – Good
- Opened the checkout page, which also loaded that URL. The first time, it showed up. After that, it remained pending. Even if I just opened one tab, I could still see the problem. And as per the previous explanation, it was because of the origin’s slow response. However, the question was why it was so different for a GET request while we were using the same codebase, with no difference between AU and NZ – Issue here
That meant we needed Section IO to do some further investigations on the issue and tell us what the difference was between AU and NZ if they were supposed to function the same. Together, we started looking into the ALB configuration and looked at whether it was IP-based, since Sticky Session was enabled?
Below is our AWS ALB configuration. We were using the same ALB for both AU and NZ.
In the following investigation, Section IO found that there could be a conflict between what the PageSpeed module does with a request and how our web server processed it. When the Pagespeed module was disabled, we couldn't reproduce the issue any more. We didn't see the issue with more than 60 seconds of AcquireRequestState anymore. Everything was functioning as expected. This meant that we now knew where the problem was coming from. However, what exactly in the Pagespeed module was the cause?
Root Cause
This is what Section IO found.
The issue was caused by two factors. Firstly, it appeared from the outside that the web server does not use a shared session database. Secondly, PageSpeed allows a TCP connection to be reused. The combination of these two behaviors causes the following:
-
- A request arrives at Section platform, and if it is a cache miss, which is always the case for a checkout request, Section platform will open a TCP connection to our origin servers and send the request. Remember that Section always has multiple duplicates of each container for high availability, this includes containers used to make connections and requests to our origin web servers. This type of container is called an egress container. Let's say in this case it goes through Section Egress X.
- The request hits AWS ALB and AWS, using the round-robin algorithm, decides to which of the servers to send the request. The request is sent to the selected web server, let's call this web server A, and a response is generated and sent back to Section, all is good. Web server A has a list of browsers that have sessions that it keeps. This list doesn't seem to be shared with other web servers. Here is where the issue begins.
- PageSpeed allows the TCP connection to stay open between Egress X and web server A, which is actually good behavior from one angle because the same connection can be used for future requests. This is standard internet behavior as explained by Section IO.
- Another checkout request hits Section platform. If this request goes through a different Section Egress, then this is not a problem as Section will open a new connection, AWS selects a server and a connection is made and this new server will respond normally to the request. However, if Section Egress X was used to connect the same connection that is used to send the request, this request will always go to web server A. If web server A has this browser’s session cookie in its session DB, all is well and a response is sent back. But if the session was stored on another web server and web server A cannot access this session info, then it becomes stuck. This is likely why New Relic is reporting so much time taken in the AcquireRequestState function.
This sounded both correct and incorrect to me. it was just a little confusing to me, especially point #4.
I understood that we didn’t have a shared session state DB, but there was one reason why I was not convinced: Sticky Session was enabled. Based on what Section IO reported, if the request was sent to the same web server A again, then the session info should have been there already. InProc mode is used by default by the web app which stores the session state in the memory of web servers. So, there shouldn’t have been any lock or deadlock in the DB or AcquireRequestState at that moment. This was more about how IIS handles the requests. How come it was taking more than 60 seconds to acquire a session state. If we look into the single request for the loadminicart API call, even if we opened multiple tabs in one browser, with the Round-robin algorithm on ALB, it was still responding quickly.
Let's have a look at the following diagram on Session Stickiness. Requests from the same session should be sent to the same web server, not different web servers, unless the sticky session is expired, which, I believe, was not the case for us, as we had configured it for 7 days.
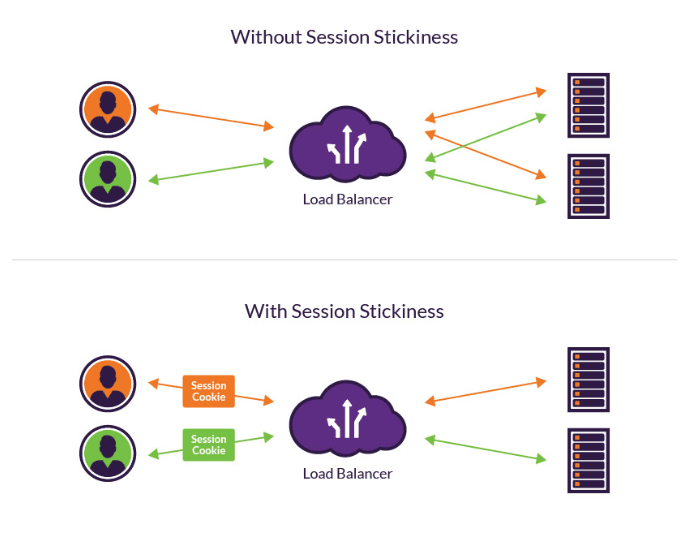
This article also has a section called “What is the Difference Between Load Balancer Sticky Session vs. Round Robin Load Balancing?” which gives us an idea about how Sticky Session works with Round-robin load balancer.
Section IO also confirmed the possibility that requests from the same session might be delivered to different web servers by multiple Egress containers. This means that somehow, the Pagespeed module on Section IO changed the behavior of the Sticky Sessions on AWS ALB (assuming the target web server is completely healthy). So, a request which should have been sent to web server A was somehow being sent to web server B, C... This caused the problem with AcquireRequestState. The only way Section IO could make their Pagespeed module function well was to implement shared sessions across the multiple web servers. That’s why shared session state DB is recommended by Section IO.
Ta DA. We had finally gotten to the bottom of the issue.
Solutions
So what are the options to fix it?
- Let's get rid of the Pagespeed module on the NZ site and replace it with a Kraken and Openresty modules stack, just like what we have for the AU site.
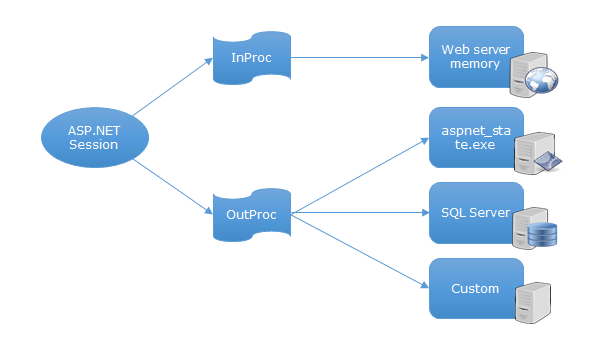
- Let's improve the SessionStateProvider on our site from In Proc to Out Proc with either of these options
- Introduce another shared session state database
- Or use a distributed session management provider based on AWS ElastiCache, Memcached or Redis or even Dynamo
Have anything to add to this approach or do you have similar issues with which you need help? Leave a comment or contact us today!
to transform your business and drive results?

