How data-driven web design boosts engagement and drives results

Every $1 invested in UX brings a $100 return (Forbes). And that’s not coming from “I think this color looks nice” or “Let’s move the button and hope it works”. That’s data.
Data-driven web design takes the guesswork out of the process. Instead, you use real user behavior, analytics, and testing to guide every decision. The result? Websites that perform, convert, and actually do their job.
So, buckle up. We’re about to show you how data-driven design can turn your website from a page into a conversion-driven powerhouse.
Key aspects of data-driven web design
From an interview with Niteco’s UXUI design lead – Chieu Phung, we uncovered the key pillars of data-driven web design. With over a decade of experience helping major brands fine-tune their websites and elevate user experiences, Chieu breaks down the essential phases every data-driven design process should go through. Here they are:
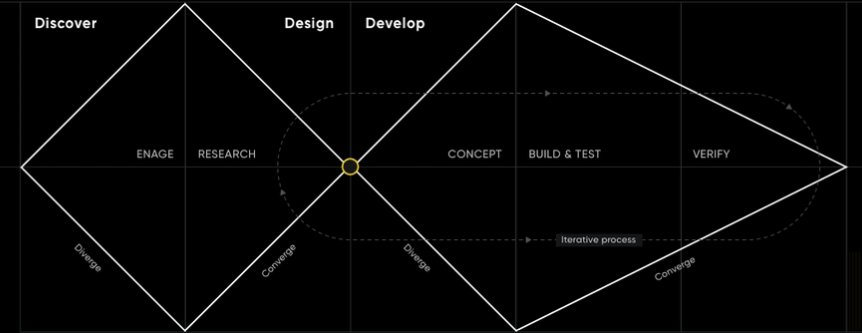
Niteco's design thinking process
1. Discover phase: Data collection and analysis
Within the Research step of the Discover phase, the foundation of data - driven design is established. This is where data collection and analysis take place. By gathering both qualitative and quantitative user data - such as behavior tracking, user interviews, and feedback - teams gain a clear understanding of user needs and pain points.
After the analysis, findings are distilled into clear, actionable insights. These insights inform the direction of the upcoming design work, ensuring it's not based on assumptions but on evidence-backed understanding.
2. Design phase: Hypotheses and ongoing validation
In the Design phase, ideas begin to take shape, but the role of data doesn’t stop. Often, new hypotheses arise during the concept creation. These assumptions need verification - meaning the team may loop back to collect and analyze more data to refine the direction. This iterative loop ensures flexibility and adaptation as new insights surface, even before reaching development.
3. Develop phase: Concept, build and test, verify
Before handing them off to developers, concepts are prototyped and tested. Here, data collection happens through usability tests, measuring factors such as task success rate, error frequency, and qualitative feedback. This step helps determine whether a design solution effectively addresses the user problem. If it doesn’t, refinements are made based on test results.
The validation loop: Tests and continuous optimization
Throughout every phase - Discover, Design, and Develop - A/B testing plays a vital supporting role. In fact, it can be run as a parallel workstream that mirrors the core steps of the design process: forming hypotheses, testing solutions, and analyzing results. By comparing two or more design variations using real-time data, teams gain valuable insight into what truly resonates with users - backed by actual behavior, not assumptions.
But the process doesn’t end at launch.
Chieu stressed, “Build, test, and verify is not a one-and-done job - it’s an iterative process. Actually, even when you’ve moved on to the design stage, new hypotheses can still arise that need to be verified. So, at that point, you’ll need to collect and analyze more data.”
After rollout, performance tracking becomes crucial. Key metrics like conversion rates, bounce rates, and task completion... are analyzed to measure the impact of the new design. These insights often spark new hypotheses, triggering another round of testing and refinements.
Why data-driven design matters
Modern web design isn’t just about making things look nice. It’s about making decisions based on actual user behavior - not gut feelings or internal debates. Whether it’s where to place a button or how long a page takes to load, data gives you the answers.
Improve user experience
Data-driven design helps you understand what your users actually want - not what you think they want. With real insights from user behavior, feedback, and interaction patterns, you can tailor experiences to meet specific needs. And considering that 94% of first impressions are based on your site’s design, those first few seconds are critical.
By using data to shape navigation, layout, and content, you’re not just guessing - you’re creating a more intuitive, engaging experience that keeps users sticking around (and coming back).
Improve conversion rates and ROI
A well-designed user experience can boost your website’s conversion rates by as much as 200%. So, let’s be real - you’re not redesigning your site for fun. You want results. Data-driven web design can help improve customer experience, increase sales, reduce bounce rates, and improve conversions. So, you have the answer, data-driven web design is not a nice-to-have - that’s a business no-brainer.
Increase efficiency and productivity
No more endless rounds of guesswork and design debates. Data narrows the focus, helps you prioritize what actually matters, and speeds up the whole process. Teams using data can cut redesign timelines while reducing costly rework and design debt.
How data-driven design enhances user engagement
Understanding your audience through data
You can’t engage users you don’t understand. That’s why tools like Google Analytics, Hotjar, or Microsoft Clarity are goldmines. They reveal what users are clicking on, how far they scroll, where they bounce, and even how their mouse dances around the screen.
For example, let’s say users keep dropping off your pricing page. Is it the copy? The layout? With heatmaps and session recordings, you can identify pain points - maybe that tiny font isn’t doing you any favors.
Beyond user behavior, demographics and preferences help paint a full picture. Are your visitors mostly mobile-first Gen Z users or desktop-loving professionals in their 40s? Knowing this influences everything from design style to content tone. Data helps you move from “I think” to “I know,” and that’s powerful when tailoring UX.
Personalization strategies
One-size-fits-all doesn’t work in fashion, and it definitely doesn’t work in web design. With the right data, you can serve up an experience that feels like it was made just for your visitor.
Imagine this: a returning user sees their previously viewed products on the homepage. A first-time visitor is greeted with a welcome pop-up tailored to their region. Whether it’s recommending blog posts based on reading history or displaying relevant CTAs depending on user behavior, personalization keeps people engaged - and coming back for more.
Netflix, Spotify, and Amazon didn’t become giants by treating everyone the same. They used data to deliver experiences that felt like magic. You can too - just without the billion-dollar tech budget.
Read how personalized marketing can unlock endless business growth
A/B testing for enhanced usability
Think of A/B testing as your website’s “trial-and-error” buddy - but backed by real results, not hunches. Should your CTA button be blue or red? Should you put the sign-up form at the top or bottom? A/B testing gives you the answer.
By comparing different design elements - layouts, headlines, images, even microcopy - you can see which version actually performs better with your audience. The result? Higher engagement, better conversions, and fewer “why isn’t this working?” moments.
A/B testing turns “design instincts” into “design insights.”
Optimizing performance metrics
No one has time for a slow website. In fact, 40% of online users will leave a site if it takes more than 3 seconds to load. And don’t even get us started on websites that aren’t mobile-friendly in 2025. That’s a fast track to losing engagement - and credibility.
Use tools like Niteco’s Performance Insights or PageSpeed Insights to monitor site performance. Tweak what slows you down, compress images, minimize code, and optimize for mobile. The faster and smoother your site, the more users will stick around and explore.
And don’t forget consistency. A responsive, visually cohesive experience across devices builds trust. Whether your users are on a laptop, tablet, or phone, your site should feel like home - not like they’ve wandered into a totally different place.
Learn more about data-driven marketing for Commerce
Conclusion
Data-driven design isn’t just a trend - it’s a proven way to boost engagement, improve user experience, and drive higher ROI. When every decision is backed by real user insights, your website becomes a powerful tool for growth.
Ready to elevate your site with data-driven web design? Talk to our experts and start making smarter design decisions today.
FAQs about data-driven design
Because it replaces assumptions with evidence. Data-driven design helps you understand what users want and how they interact with your site. This leads to smarter decisions, better UX, and ultimately, stronger business results.
The process typically starts with collecting user behavior data, identifying patterns or pain points, forming hypotheses, and testing design changes through methods like A/B testing or usability testing. It’s a continuous loop of analyze, test, refine, and repeat.
Some of the most commonly used tools include:
- GA4 for tracking traffic and behavior
- Hotjar or Crazy Egg for heatmaps and session recordings
- Optimizely for A/B testing
- Niteco’s Performance Insights for performance and accessibility audit
Track performance using key metrics such as bounce rate, conversion rate, time-on-site, page load speed, and user feedback. Comparing these metrics before and after making changes will help you determine whether your design updates had a positive impact.
